⚡️ My Quantified Self Set-up
Apr 09, 2021 • 7 min • Quantified Self
When I published my inaugural quantified self report a week ago, I ended up getting a few questions about how I track various metrics. While I suspect this system will evolve over time, I can share what it looks like at the moment.
Overview
I've been tempted to start a project like this for several years, but I've resisted up to this point. I'm super conscious of being overly-analytical to the point where it removes spontaneity from daily life. I'm also hesitant to take on any projects that require long-term, recurring commitment.
With that being said, I feel like I've created a system that avoids both of those pitfalls. And as someone who has been interested in data and self-improvement since I was young, I suppose this was always inevitable.
I currently use an Airtable spreadsheet as my operating system for all things quantified self. I'll update it once a day, as part of my morning routine.
I'm planning on revising this spreadsheet annually, but right now the data spans 8 categories: Sleep, Wellness, Audience, Phone, Desktop, Fitness, Reading, and Location.
Side note: I enjoy spreadsheet apps more in dark mode and since that functionality isn't available in Airtable yet, I've been using Dark Reader as a solution. I like it a lot so far.
😴 Sleep
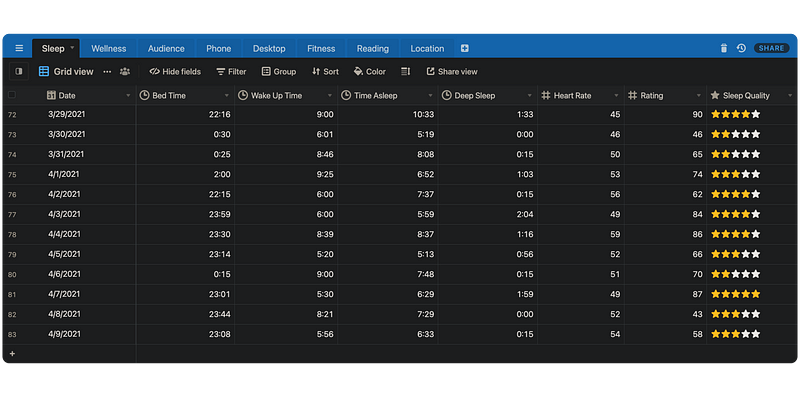
Sleep is one of the first things I started tracking. Given the impact that it has on how I feel, it's a no-brainer in my opinion. I use a 44m Apple Watch Series 5 and the AutoSleep app to collect data and then I manually input it into the Airtable spreadsheet.
Metrics:
- Bed Time (hh:mm)
- Wake Up Time (hh:mm)
- Time Asleep (hh:mm)
- Deep Sleep (hh:mm)
- Heart Rate (bpm)
- Rating (1-100)
- Perceived Sleep Quality (1-5)
Ideally I would like to automate this in the future. AutoSleep does have an export feature, but I'm unsure of an existing API that I could hook up to Zapier.
🙏 Wellness
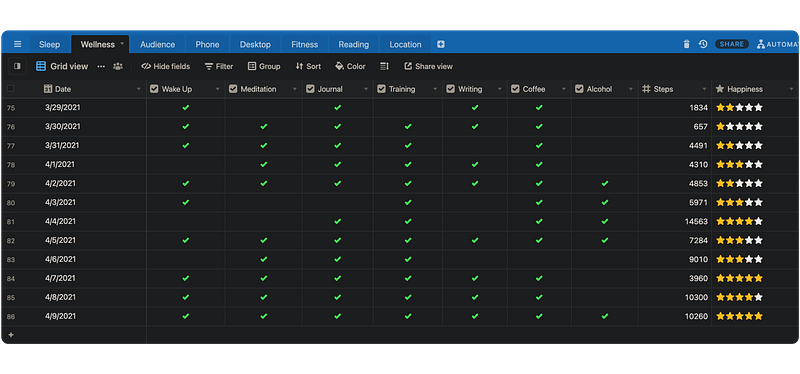
This is a bit of a catch-all section, but probably the one I care about most. It's where I track things like habit completion, general movement, and perceived happiness.
I track my steps using Apple Health and log the previous day's total manually. Perceived happiness is obviously subjective, so I rate how I'm feeling from 1-5 at that moment.
Metrics:
- Wake Up (y/n)
- Meditation (y/n)
- Journal (y/n)
- Training (y/n)
- Writing (y/n)
- Coffee (y/n)
- Alcohol (y/n)
- Steps (number)
- Perceived Happiness (1-5)
Over time, I've added more habits to this list, namely coffee and alcohol. While not exactly habits, I did find that my behavior there was impacting sentiment and productivity so I decided to include them.
🤝 Audience
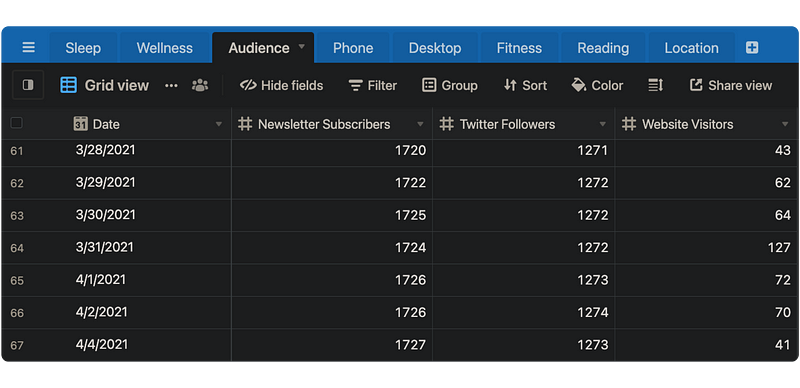
I like sharing ideas and learnings online, whether it's through my weekly newsletter, writing on this site, or posting to Twitter. I keep an eye on audience size and track basic counts of audience size on each.
Metrics:
- Newsletter Subscribers (number)
- Twitter Followers (number)
- Website Visitors (number)
I would really like to automate logging these numbers in the future, since I find that inputting them daily leads to me thinking about them too much, when they really aren't the goal.
📲 Phone
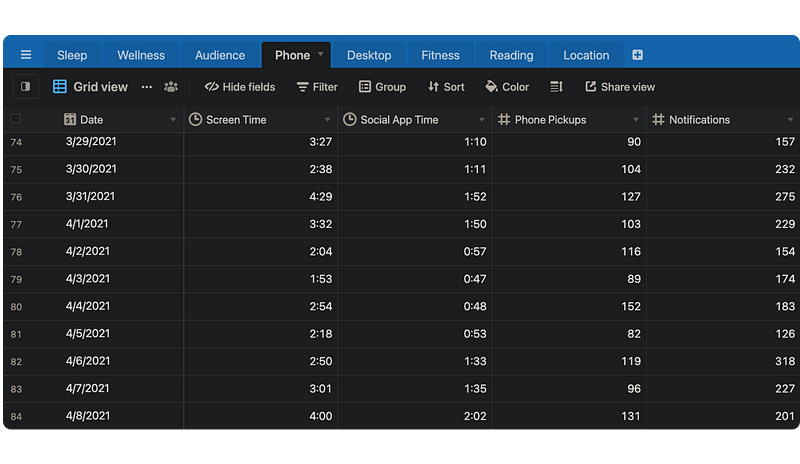
Tracking screen time has really useful for identifying when I'm not being mindful enough in my daily life. I track engagement on my phone manually with Apple Screen Time at the moment.
Metrics:
- Screen Time (hh:mm)
- Social App Time (hh:mm)
- Phone Pickups (number)
- Notifications (number)
While it's not perfect, it's the only way I know of with an iPhone, and it's mostly accurate. The Apple ecosystem doesn't exactly play nice with external APIs to put it lightly.
💻 Desktop
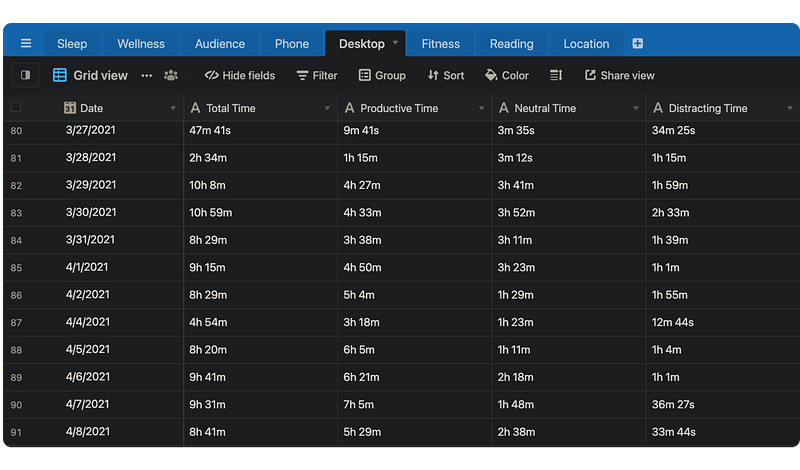
On the other side of screen time is desktop engagement. I was able to automate this pretty easily using RescueTime + Zapier. If you aren't familiar with RescueTime, it basically sits in the background and tracks what apps and sites I'm using. Some of the default categorization (Productive vs. Distracting) needs tweaking, but otherwise it's great.
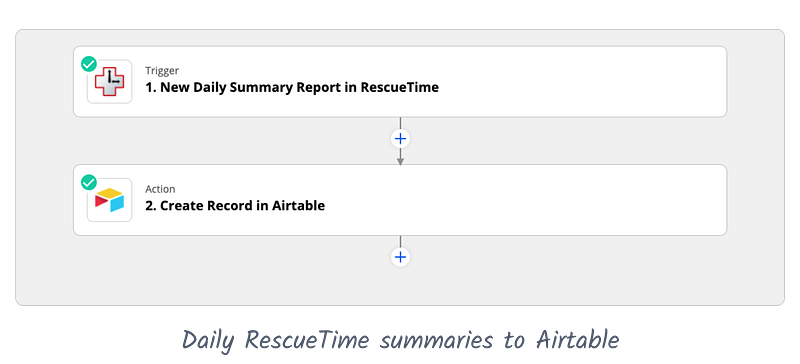
Metrics:
- Total Time (hh:mm)
- Productive Time (hh:mm)
- Neutral Time (hh:mm)
- Distracting Time (hh:mm)
I haven't found a great way to make this data actionable yet, but I suspect there's something out there. Of course, I don't want to make "time spent" the goal for pretty much anything project-related.
🏋️♀️ Fitness
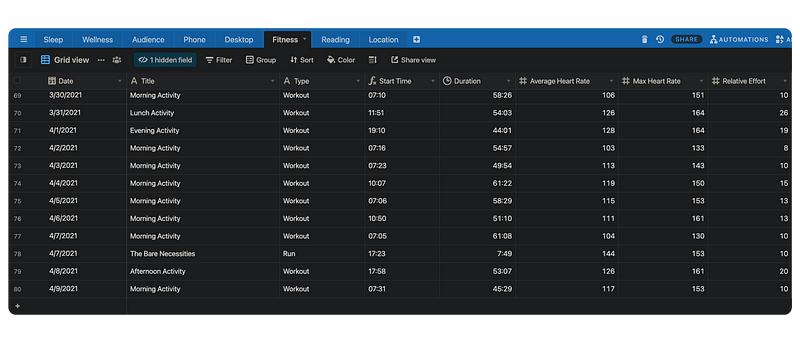
Fitness is a big part of my daily routine, so I like monitoring frequency and basic heart rate data. I've automated logging my workouts using Apple Watch + Strava + Zapier. Basically, whenever I go on a run or lift weights, I start a session using the Strava app on my Apple Watch. Then when I end that session, Zapier detects it and logs the entry in Airtable.
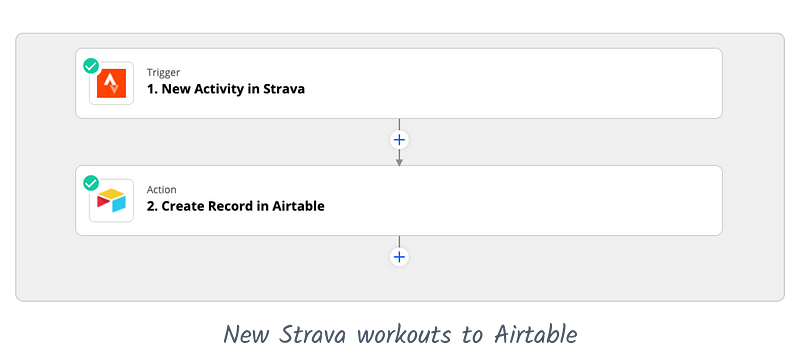
Metrics:
- Workout Title (string)
- Type (string)
- Start Time (hh:mm)
- Duration (mm:ss)
- Average Heart Rate (bpm)
- Max Heart Rate (bpm)
- Relative Effort (number)
Beyond just quantified self, Strava is one of my favorite apps I've gotten into over the last year or so. I was skeptical of the social features initially, but I've been convinced as more and more of my friends join the platform.
📚 Reading
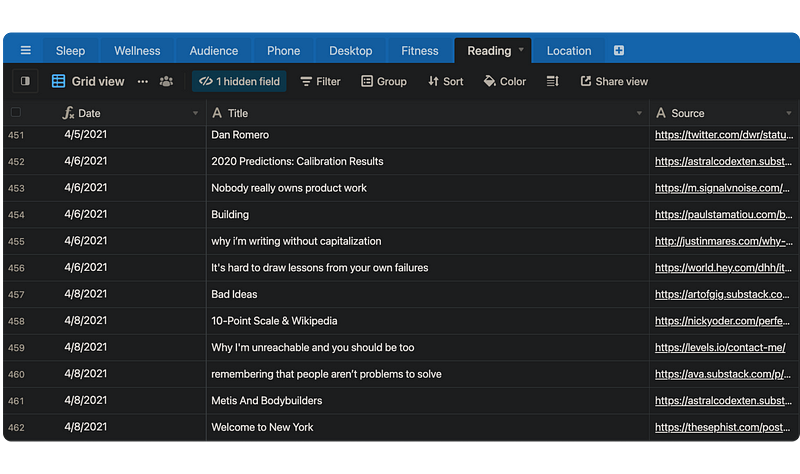
I read a lot of articles online, for better and worse. I use Pocket for managing my online reading workflow right now (though I don't love it) so anytime I'm done with an article or blog post, I archive it there. Zapier listens for this and automatically logs a new entry in Airtable with some basic info about the article.
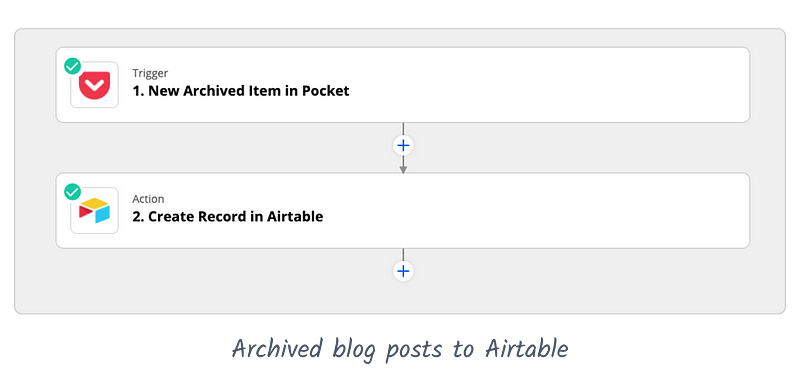
Metrics:
- Title (string)
- Source (link)
Quite frankly, I haven't found this data to be all that useful so far. In the future, I've played with the idea of tagging articles I like and piping them out to a Telegram feed for others to subscribe to, but right now the manual process of hand-picking links for Oversimplified seems to work well. I'd also love to find a way to track reading on my Kindle, but no luck there quite yet.
🌎 Location
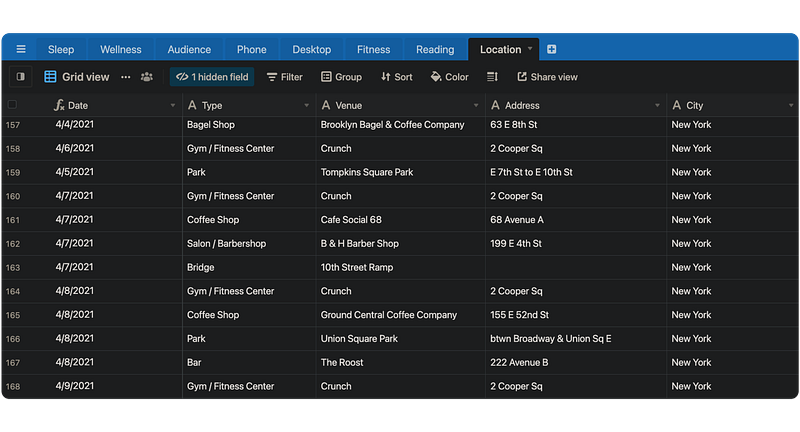
Last but not least is location. I use Swarm to check-in to places and venues that I visit, from outdoor parks to coffee shops to airports. This serves as a chronological log of the places I go.
I was skeptical of how much work that sounded like at first, but Swarm tracks everything in the background so it actually doesn't take up that much mental real estate. Whenever I register a check-in on Swarm, Zapier automatically goes ahead and logs it in Airtable.
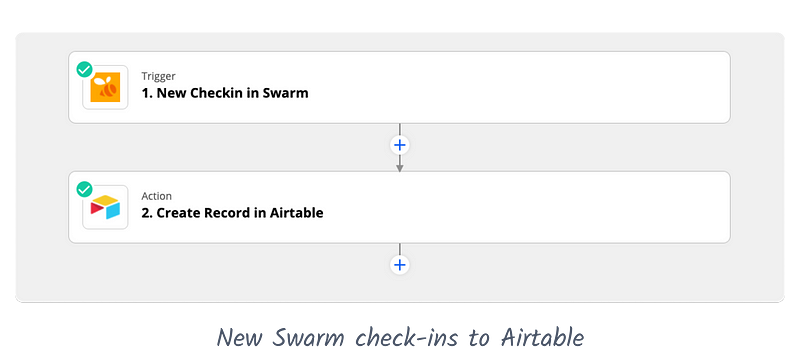
Metrics:
- Type (string)
- Venue (string)
- Address (string)
- City (string)
- Latitude (number)
- Longitude (number)
One thing that I'd like to add here is a "been here before" metric (which is available from the Swarm API) so I can quantify some aspect of how much I'm "trying new things" in a given quarter or year.
Closing thoughts
That's just about it for my quantified self set-up. As you saw above, there's definitely a manual aspect, but it usually doesn't take more than 5 minutes to input all the data.
In terms of automation, Zapier and Airtable will get you a long way! Full disclosure though, I do pay for both of these tools. You can get decently far with the free plans (especially Airtable) but if you track as much as I do, you'll have to eventually pull out the credit card. So far though, I feel like I'm getting enough value and enjoyment out of this project to merit the cost.
Thanks for reading! If you enjoyed this post and you’re feeling generous, you can perhaps follow me on Twitter. Even better, you can subscribe in the form below to get future posts like this one straight to your inbox. 🔥